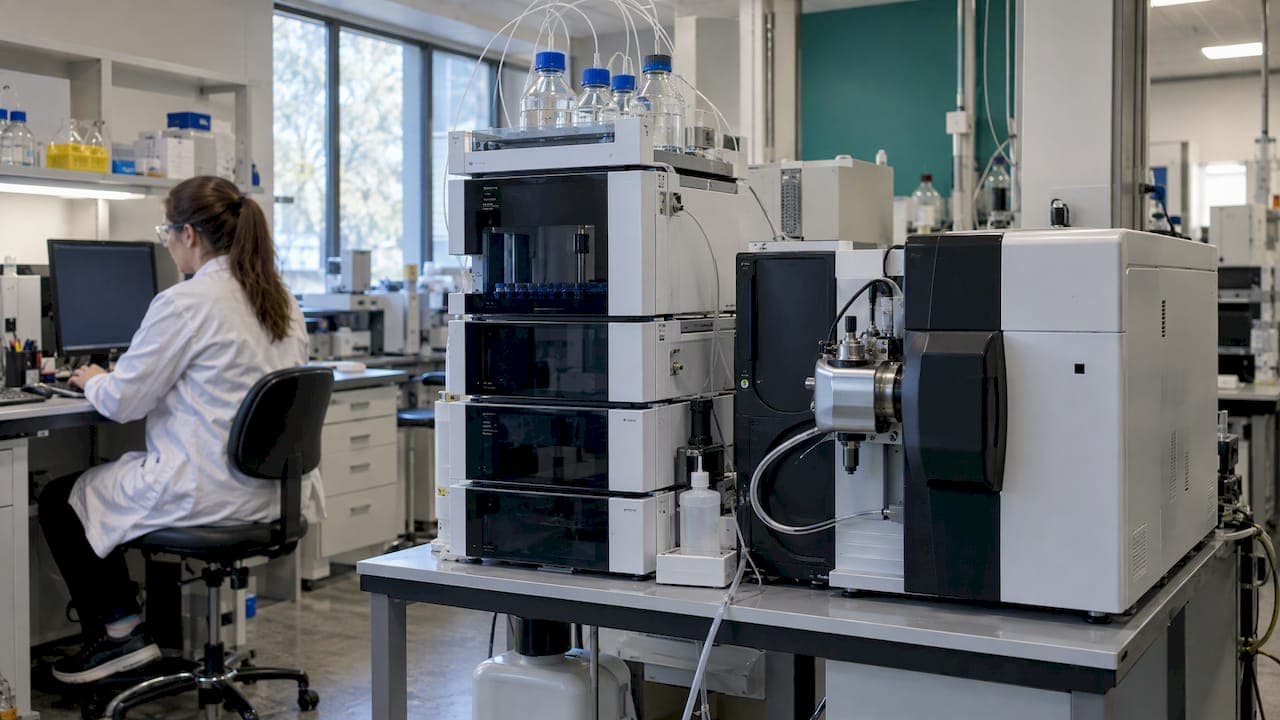
A peak purity index measures how consistently the UV spectra across one chromatographic peak match each other. It does not prove the peak holds only one peptide. Spectrally silent or similar-spectrum co-eluters pass unnoticed. When a peptide is critical or the UV result is borderline, request LC-HRMS or 2D-LC-MS confirmation before relying on the number.
TL;DR:
- Keep peak absorbance below roughly 1 AU, exclude wavelengths near the solvent cutoff, and review sensitivity because processing choices can change the purity flag.
- One LC HRMS study detected peptide impurities at or below 0.1% of API concentration, with limits as low as 0.02 to 0.04 μM.
- Use a second chromatographic dimension with mass spectrometry for complex peptide impurity profiles or borderline decisions; reported workflows distinguish related species below 1% abundance.
- Regulatory guidance calls for reporting peptide impurities above 0.1%, identifying them above 0.5%, and qualifying them above 1.0%; unresolved peaks need justification.
- For routine peptides with established profiles, UV may suffice when curves are clean; request raw chromatograms, method details, and independent mass spectrometry for critical batches.
Table of Contents
- 1. How is UV/DAD peak purity calculated?
- 2. Why do LC-MS and LC-HRMS catch what UV misses?
- 3. When does 2D-LC-MS resolve co-eluting isomers?
- 4. What do MAM and New Peak Detection add?
- 5. What do regulators expect for peptide impurity reporting?
- 6. How do you read a peptide COA and check peak purity?
- 7. Why we pair HPLC purity with mass spectrometry
- 8. Request fully documented peptides from Peptastic Labs
- FAQ
- Sources
1. How is UV/DAD peak purity calculated?
A diode array detector (DAD) captures spectra continuously across a peak. Software corrects the baseline, compares each spectrum to a reference spectrum, and reports an overall match factor, often labeled the UV purity value. A purity curve and spectral overlays show where the peak deviates.
Settings that change the result:
- Wavelength range: exclude the region near the solvent cutoff to avoid noisy spectra.
- Threshold and sensitivity: low thresholds flag noise, high thresholds miss real impurities.
- Baseline correction: poor correction distorts edge spectra.
- Absorbance linearity: keep peak absorbance below roughly 1 AU.
Vendor defaults differ, so reprocessing the same data can flip a pure/impure flag.
The Agilent portal recommends keeping absorbance below 1 AU, and notes that non-chromophoric impurities and similar spectra cannot be distinguished by UV.
A "pure" result lowers the odds of a co-eluting impurity. It does not remove them.
2. Why do LC-MS and LC-HRMS catch what UV misses?
Mass spectrometry can reveal impurities that UV may miss, including species with no chromophore or a UV spectrum similar to the main peptide. LC-HRMS adds accurate mass, which supports composition and sequence confirmation in the same run.
- A published LC-HRMS method on model peptide drugs detected impurities at or below 0.1% of API concentration in some systems.
- The same work reported limits of detection for several impurities as low as 0.02–0.04 μM, with accuracy above 85% in spiking experiments.
- A review of LC-MS characterization covers techniques for structural isomers and stereoisomers, two impurity types UV handles poorly.
- Accurate-mass workflows give a peak purity indication plus precise masses for observed impurities.
A practical workflow: run LC-HRMS on suspect peaks, or as orthogonal confirmation for critical batches. For method selection, see our comparison of HPLC versus LC-MS for peptide QC, and our LC-MS/MS workflow for peptides for stepwise detail.
3. When does 2D-LC-MS resolve co-eluting isomers?
Two-dimensional LC re-separates the main peak on a second column with different selectivity, then sends the result to MS. Closely related species that co-elute in one dimension can separate in the other. A systematic workflow uses retention modelling and shallow second-dimension gradients to place the main peak in an elution window tuned to resolve related species. Updating the peptide-specific retention model after initial experiments improved prediction accuracy, and the conditions were implemented across different laboratories to detect low-abundance impurities.
Steps in a typical heart-cutting approach:
- Run the first-dimension reversed-phase method and select the main peak window.
- Transfer the cut to a second column with different chemistry.
- Apply a modelled, shallow gradient to spread closely related species.
- Identify and quantify what emerges by MS.
Reported results show that these techniques can distinguish species below 1% relative abundance that stay masked by the main peak in 1D-LC-UV. Coverage in Chromatography Online discusses column and mobile-phase pairing.
Pro Tip: Adopt 2D-LC-MS when the impurity profile is complex, the peptide is therapeutic-grade, or identification and qualification thresholds are borderline.
4. What do MAM and New Peak Detection add?
The Multi-Attribute Method (MAM) with New Peak Detection (NPD) compares a sample to a reference and flags new or changing site-specific attributes without prior assumptions. A published purity method shows it can serve as a purity test and reduces the subjectivity of UV-based checks.
- Strength: site-specific tracking, identification and quantification in one experiment.
- Caveat: false positives and artifacts limit widespread implementation.
- Controls: curated known-peak lists, pairwise analysis, and an NPD system suitability strategy.
- Validation tip: use sequence-variant co-mixes to measure how well NPD detects spiked variants.
MAM does not replace chromatographic judgment. It adds an unbiased layer that shows what changed between batches.
5. What do regulators expect for peptide impurity reporting?
The EMA guideline on synthetic peptides sets expectations for peptide-related impurities.
- Report above 0.1%.
- Identify above 0.5%.
- Qualify above 1.0%.
- When one method cannot separate every impurity, orthogonal approaches are recommended.
- When impurities remain unresolved, expect combined-peak thresholds and written justification.
Reporting above 0.1%, identification above 0.5% and qualification above 1.0% are the thresholds that frame what a UV-only result must clear.
Absolute purity is assigned by mass balance. The USP reference standards document describes combining HPLC area percent with counterions, residual solvents and residue on ignition to derive purity on an anhydrous or as-is basis. For deeper regulatory strategy, see our post on peptide impurity profiling.

6. How do you read a peptide COA and check peak purity?
Verify these items first: chromatogram image, detection wavelength, main-peak area percent, method parameters, moisture and counterion content, and any MS data.
- Confirm chromatogram settings and integration parameters.
- Examine the UV purity curve and the sensitivity used.
- Look for shoulders, tailing or unresolved peaks near the main peak.
- Check whether MS data confirms identity, not only area percent.
- Request LC-HRMS or 2D-LC-MS if anything stays ambiguous.
Ask suppliers for raw chromatograms, full method details, the batch COA, and third-party mass spec data where applicable. Our guide on requesting raw chromatograms explains how. A partner article on COA tests worth requesting covers lab-focused documentation from a supplier perspective.
Pro Tip: UV alone can suffice for routine, well-characterized peptides with clean curves. Pay for orthogonal confirmation when the peptide anchors a study or the data sits near a threshold.
7. Why we pair HPLC purity with mass spectrometry
We independently test each batch by HPLC and mass spec and issue Certificates of Analysis on request. A purity percentage means little without the chromatogram behind it. The right depth depends on what your study can tolerate: more analysis costs time, and our team helps match one to the other.
— Tintastic
8. Request fully documented peptides from Peptastic Labs
We supply research-grade peptides with HPLC testing and batch documentation on request.  Researchers can request a COA and contact us for bulk or wholesale documentation. Our catalogue spans Metabolic, Cognitive & Neuro, Tissue & Repair, Longevity, Cosmetic Science and more. Qualified researchers who need fully documented peptides can browse the Peptastic Labs catalogue and request documentation with an order.
FAQ
How is peak purity calculated in HPLC?
A DAD compares UV spectra across a peak after baseline correction and reports an overall match factor. Wavelength range, threshold and sensitivity settings change the outcome, so the same data can pass or fail under different processing.
What is a good purity level for research peptides?
For research-grade peptides, an appropriate purity level depends on the intended use and the supporting test data. For regulatory-style work, peptide-related impurities are reported above 0.1% and identified above 0.5%.
Is a pure UV result enough to trust a peptide?
Not always. UV cannot see impurities without chromophores or with matching spectra. Orthogonal confirmation by LC-HRMS or 2D-LC-MS closes that gap for critical work.
What makes a good peak in HPLC?
A good peak is symmetric, well resolved from neighbors, and free of shoulders. Check that integration is consistent and that absorbance stays in the linear range.
Sources
- A Strategy for assessing peak purity of pharmaceutical peptides in reversed-phase chromatography methods using two-dimensional liquid chromatography coupled to mass spectrometry. Part II: Development of second-dimension gradient conditions
- Pubmed
- Liquid Chromatography-High Resolution Mass Spectrometry for Peptide Drug Quality Control
- A Robust Purity Method for Biotherapeutics Using New Peak Detection in an LC-MS-Based Multi-Attribute Method
- Guideline on the Development and Manufacture of Synthetic Peptides