
Peptide–receptor binding affinity is the equilibrium strength of a peptide–receptor interaction, most commonly reported as the dissociation constant Kd. Lower Kd means tighter binding: peptides with very low nanomolar or subnanomolar Kd values indicate stronger binding, while higher micromolar values often signal weak or transient contacts, though precise numeric thresholds vary among studies. That single number, however, hides critical information. Two ligands can share an identical Kd yet have entirely different residence times because Kd = koff/kon — and it is koff, not Kd, that often determines in vivo duration of action. Before reading any spec sheet, also note that IC50 and Ki are related but not interchangeable with Kd; conversions require assay-specific corrections. Peptasticlabs supplies HPLC-verified peptides with ≥99% purity and full batch documentation precisely so researchers can enter affinity assays with a known, characterized starting material rather than an unknown variable.
Table of Contents
- What do Kd, Ki, IC50, and ΔG actually measure?
- Which experimental method should you use to measure binding affinity?
- How do computational methods predict peptide–receptor affinity?
- What biological and experimental factors shift apparent affinity?
- How should you interpret and report affinity data?
- Practical peptide preparation and QC checklist for binding studies
- Key Takeaways
- The part of affinity measurement most labs get wrong
- Peptasticlabs: research-grade peptides built for affinity work
- Authoritative resources for affinity data and computational tools
What do Kd, Ki, IC50, and ΔG actually measure?
Binding affinity is described by several related but distinct parameters, and conflating them is one of the most common sources of irreproducible data.
- Kd (dissociation constant): The molar concentration of free ligand at which half the receptor sites are occupied at equilibrium. Defined kinetically as Kd = koff/kon. Units are typically M, nM, or pM. Lower Kd = higher affinity.
- Ka (association constant): The reciprocal of Kd (Ka = 1/Kd). Occasionally reported in SPR literature; higher Ka = higher affinity.
- Ki (inhibition constant): An assay-independent measure of a competitor's affinity for the receptor, derived from competition experiments via the Cheng–Prusoff equation: Ki = IC50 / (1 + [L]/Kd,radioligand), where [L] is the radioligand concentration. Ki is preferred over IC50 for cross-study comparisons because it removes the dependence on radioligand concentration.
- IC50: The competitor concentration that displaces 50% of a labeled ligand under specific assay conditions. IC50 shifts with radioligand concentration and receptor density, so it is not transferable between labs without the Cheng–Prusoff correction.
- ΔG (Gibbs free energy of binding): Directly linked to Kd by the thermodynamic relationship ΔG° = RT ln(Kd), where R = 8.314 J mol⁻¹ K⁻¹ and T is temperature in Kelvin. At 25°C (298 K), a Kd of 1 nM (10⁻⁹ M) gives ΔG° = 8.314 × 298 × ln(10⁻⁹) ≈ −51.7 kJ/mol. A 10-fold tighter binder adds roughly −5.7 kJ/mol.
The kinetic view adds another layer. Kd collapses two rate constants into one number. A peptide with kon = 10⁶ M⁻¹s⁻¹ and koff = 10⁻³ s⁻¹ has the same Kd as one with kon = 10⁵ M⁻¹s⁻¹ and koff = 10⁻⁴ s⁻¹, but the second peptide dissociates ten times more slowly. Residence time (τ = 1/koff) often correlates better with in vivo pharmacological duration than Kd alone, particularly when receptor occupancy fluctuates with plasma concentration. Reporting both Kd and the individual rate constants is therefore the more complete and reproducible practice.
Which experimental method should you use to measure binding affinity?
Method selection determines which parameters you can report, what sample quantities you need, and which artifacts you must control for. No single technique answers every question.
Comparison of standard affinity measurement methods
| Method | Parameters measured | Throughput | Key strengths | Principal artifacts / limitations | Typical sample requirement |
|---|---|---|---|---|---|
| SPR (Biacore) | Kd, kon, koff | Medium | Label-free; full kinetics; real-time | Mass transport limitation; surface orientation; rebinding | 50–500 µg receptor or peptide |
| ITC | Kd, ΔH, stoichiometry (n) | Low | Direct thermodynamics; no label | High sample consumption; requires soluble, concentrated protein | 1–5 mg protein per run |
| BLI (Octet) | Kd, kon, koff | High | Plate-based; tolerates crude samples | Surface crowding; tip-to-tip variability | 50–200 µg; tolerates serum |
| MST (MicroScale Thermophoresis) | Kd | Medium | Low sample volume; works in solution | Fluorescent label required (or intrinsic); label position effects | 5–20 µg peptide |
| Radioligand (saturation/competition) | Kd, Bmax, Ki | High | Gold standard for GPCRs; membrane-compatible | Radioactive waste; specific activity variability; non-specific binding | Membrane prep; µg–mg range |
| Fluorescence polarization (FP) | Kd, IC50 | High | Homogeneous; HTS-compatible | Inner filter effect; label size relative to peptide | Sub-µg peptide; µM–nM range |
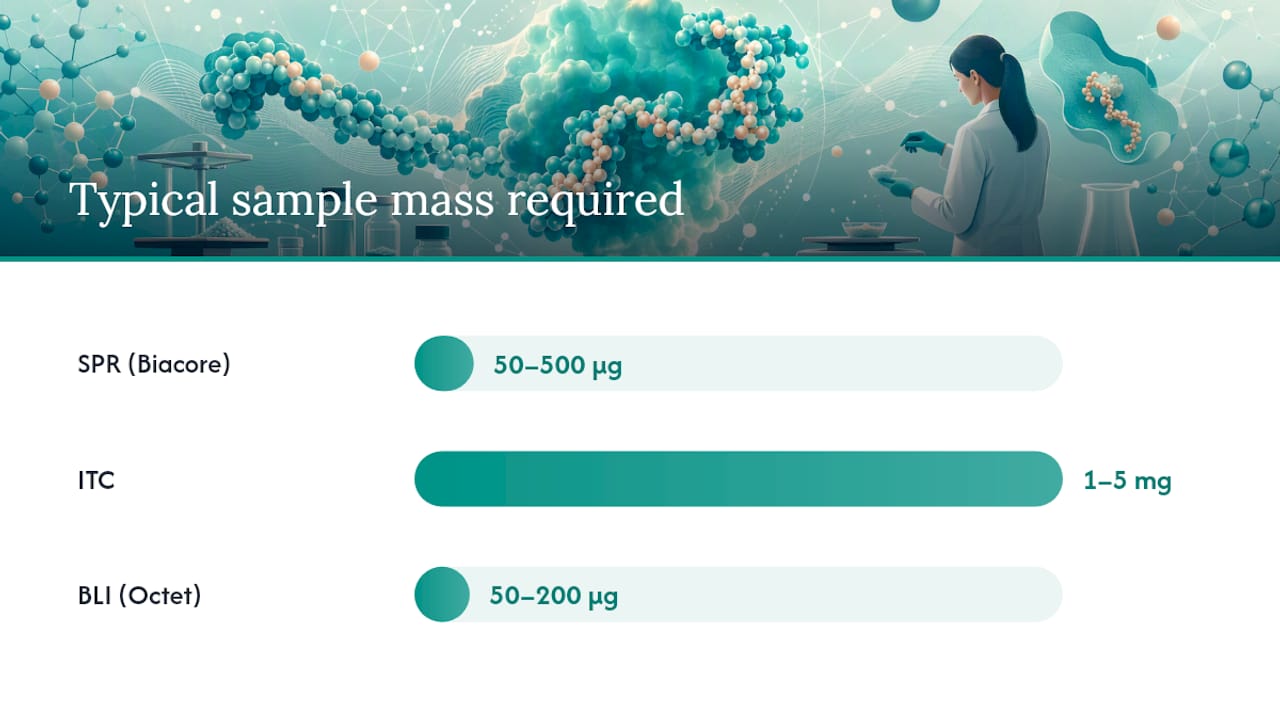
SPR on Biacore instruments remains the most information-rich label-free method when full kinetics are needed, but mass transport artifacts inflate apparent kon for fast binders unless multiple flow rates and surface densities are tested. ITC is the only method that directly measures ΔH and stoichiometry in a single experiment, making it indispensable when thermodynamic decomposition is part of the study design. BLI on Octet platforms offers higher throughput and tolerates more complex matrices, at some cost to kinetic precision. MST works well for small peptides and membrane-associated targets where immobilization is impractical, though label position relative to the binding interface must be validated.
For membrane receptor targets, particularly GPCRs where receptor density and regulation directly alter apparent affinity, radioligand competition binding in native membrane preparations or reconstituted proteoliposomes is often the most physiologically relevant starting point. Fluorescence polarization is the preferred format for high-throughput screening of peptide libraries because it is homogeneous, fast, and requires no washing steps.
Practical pre-assay QC steps to run before committing to a full experiment:
- Confirm peptide purity by analytical HPLC (≥95% for initial screening; ≥99% for publication-grade data).
- Verify molecular weight by mass spectrometry to confirm sequence integrity and detect oxidation or truncation.
- Check solubility at working concentration; use dynamic light scattering (DLS) to detect aggregates above 1 µM.
- Run a blank injection (buffer only) and a negative-control peptide to establish baseline signal and non-specific binding.
- Use control compounds with known affinity to validate assay performance before testing unknowns.
Working concentration calculation: concentration (µM) = mass (µg) / (MW (g/mol) × volume (mL)) × 10³. For a 2 mg/mL stock of a 2,500 Da peptide: 2,000 µg / (2,500 g/mol × 1 mL) × 10³ = 800 µM. Dilute from there to your assay range, typically spanning at least two orders of magnitude around the expected Kd.
How do computational methods predict peptide–receptor affinity?
Computational prediction is most useful when experimental throughput is the bottleneck, when you need to prioritize a large library before synthesis, or when structural hypotheses need testing. The methods span a hierarchy of accuracy versus computational cost.
The standard pipeline moves from fast and approximate to slow and accurate:
- Rigid docking (AutoDock Vina, Glide): Fast pose generation using a fixed receptor structure. Useful for ranking large libraries but unreliable for absolute ΔG because it ignores receptor flexibility and solvation.
- Ensemble docking: Uses multiple receptor conformations (from MD snapshots or crystal structures in the Protein Data Bank) to account for induced fit. Improves pose accuracy for flexible binding sites.
- Molecular dynamics (MD) refinement with GROMACS: Explicit-solvent MD relaxes the docked complex, captures conformational dynamics, and generates trajectories for downstream free-energy calculations. GROMACS is widely used for peptide systems because of its efficient handling of large, flexible molecules and extensive force field support (AMBER, CHARMM, OPLS).
- MM/PBSA (Molecular Mechanics Poisson–Boltzmann Surface Area): An endpoint free-energy method applied to MD trajectories. Estimates ΔG by decomposing it into gas-phase MM energy, solvation (PB or GB), and nonpolar terms. Faster than alchemical methods; typical errors are 2–5 kcal/mol for relative rankings, which is sufficient for lead prioritization but not for absolute affinity prediction.
- FEP (Free Energy Perturbation): Alchemical transformation between two ligands in separate simulations. Highest accuracy for relative ΔΔG predictions (sub-kcal/mol when well-converged), but computationally expensive and sensitive to sampling. Reserve for late-stage optimization of a small set of candidates.
- Machine-learning predictors: Feature-based regressors and deep-learning models trained on experimental Kd datasets. PPI-Affinity is a domain-specific web tool for predicting and optimizing protein–peptide and protein–protein binding affinity, trained and validated on curated interaction datasets. ML methods are fast and can capture non-additive sequence effects, but they extrapolate poorly outside their training distribution.
Rosetta provides a complementary toolkit: RosettaDock for peptide docking, Rosetta FastRelax for structure refinement, and the Rosetta energy function for scoring. Rosetta-based design has been used to engineer peptides with controlled affinity, as demonstrated in studies of ACE2-derived peptides targeting the SARS-CoV-2 receptor binding domain, where computational design predictions were validated experimentally.
Benchmarking any computational method requires a held-out test set with experimental Kd or kon/koff values. Use BindingDB for curated experimental affinity data across diverse peptide–receptor pairs. Report Pearson r and RMSE between predicted and experimental ΔG on the test set; cross-validate on multiple folds to avoid overfitting. For ML tools like PPI-Affinity, check that your target system falls within the training distribution before trusting the output. The practical recommendation: use docking and MM/PBSA for library triage, use FEP for final candidate ranking, and confirm with at least one experimental assay before advancing a compound.
What biological and experimental factors shift apparent affinity?
Measured affinity is not a fixed property of the peptide alone. Multiple variables can shift the reported Kd by an order of magnitude or more, and failing to control them is the most common source of irreproducible binding data.
Biological factors:
- Receptor subtype and isoform: Different splice variants or subtypes often have distinct binding pockets; always specify the exact receptor construct used.
- Receptor density and surface expression: Higher receptor density on cell membranes can create avidity effects that make apparent affinity appear tighter than the intrinsic Kd. Receptor upregulation or downregulation from prior drug exposure or genetic variation shifts Bmax and can alter apparent Ki in competition assays.
- Post-translational modifications (PTMs): Phosphorylation, glycosylation, or ubiquitination of the receptor can occlude the binding site or alter electrostatic complementarity. Document the modification state of the receptor construct in every experiment.
- Oligomerization and cooperativity: GPCR dimers and receptor clusters can exhibit cooperative binding; a Hill coefficient significantly different from 1 is the first diagnostic sign. Genetic variability in receptor-coding genes can also alter binding pocket geometry, a consideration addressed in pharmacogenomics-informed drug design.
- Multivalency: Bivalent or multivalent peptide constructs bind with apparent affinities far tighter than the intrinsic monovalent Kd because of avidity; always distinguish intrinsic from apparent affinity in reports.
Experimental factors:
- Buffer composition: Salt concentration modulates electrostatic interactions; a 100 mM NaCl shift can change Kd by 2–10-fold for electrostatically driven interactions. pH affects protonation states of His, Asp, Glu, and Lys residues at the interface.
- Temperature: Affinity is temperature-dependent through both ΔH and ΔS. Run all replicates at the same temperature (±0.5°C) and report it. A 10°C change can shift Kd by 2–5-fold for entropically driven interactions.
- Ligand purity: A 10% impurity in a peptide stock can suppress apparent affinity by competing for the binding site or by aggregating and sequestering the receptor. HPLC purity ≥99% before assay is the minimum for publication-grade data.
- Labeling and immobilization: Fluorescent labels or biotin tags near the binding interface reduce apparent affinity; validate label position with a label-free orthogonal assay. Surface immobilization orientation in SPR or BLI determines whether the binding site is accessible.
Mitigation strategy: run at least two orthogonal assays (e.g., SPR + ITC, or radioligand + FP), include matched positive and negative controls in every run, and document all buffer conditions and temperature in the methods section. Synthetic peptide properties including racemization, truncation, and oxidation artifacts are additional sources of variability that QC documentation catches before the assay begins.
How should you interpret and report affinity data?
A reported Kd without context is nearly uninterpretable. Reproducible affinity data requires a standardized reporting checklist and clear model selection.
Reporting checklist — minimum required elements:
- Method used (SPR, ITC, radioligand, etc.) and instrument/platform
- Buffer composition (salt, pH, additives), temperature, and assay volume
- Receptor construct: species, isoform, tag, expression system, modification state
- Peptide: full sequence, any modifications (N-terminal acetylation, C-terminal amidation, cyclization, non-canonical amino acids), purity (HPLC %), lot number, and CoA reference
- Number of independent replicates (biological and technical) and error metric (SD, SEM, 95% CI)
- Binding model used (1:1 Langmuir, two-site, Hill) and goodness-of-fit metric (χ², residuals)
Affinity vs. potency: Kd measures equilibrium binding strength. EC50 (or potency) measures the concentration producing 50% of maximum functional response. A high-affinity peptide can be a partial agonist, a full agonist, or an antagonist — affinity and efficacy are distinct properties that cannot be inferred from each other. When a study's conclusions depend on functional outcome, report both Kd (or Ki) from a binding assay and EC50 from a functional assay.
Model selection: The 1:1 Langmuir model is appropriate when Scatchard plots are linear, Hill coefficients are 1.0 ± 0.1, and residuals are randomly distributed. Biphasic saturation curves, non-linear Scatchard plots, or Hill coefficients > 1 or < 1 indicate multi-site or cooperative binding; fit these with a two-site model and report both Kd1 and Kd2 with their respective Bmax fractions.
IC50 → Ki → Kd conversion caveats: IC50 is assay-condition-dependent. The Cheng–Prusoff equation converts IC50 to Ki when the radioligand concentration and its Kd are known. Ki approximates Kd only when the competitor and radioligand bind the same site without allosteric effects. Allosteric modulators require separate models (e.g., the operational model of agonism). Always state which conversion was applied and under what assumptions.
Kinetic vs. equilibrium fitting: When SPR or BLI data are available, fit kon and koff directly from association and dissociation phases rather than deriving Kd from equilibrium plots alone. Kinetic fitting is more robust when mass transport is controlled and provides residence time (τ = 1/koff) as an additional pharmacologically relevant parameter.
Practical peptide preparation and QC checklist for binding studies
Assay failure most often traces back to the peptide, not the instrument. A structured QC workflow before any binding experiment saves time and consumables.
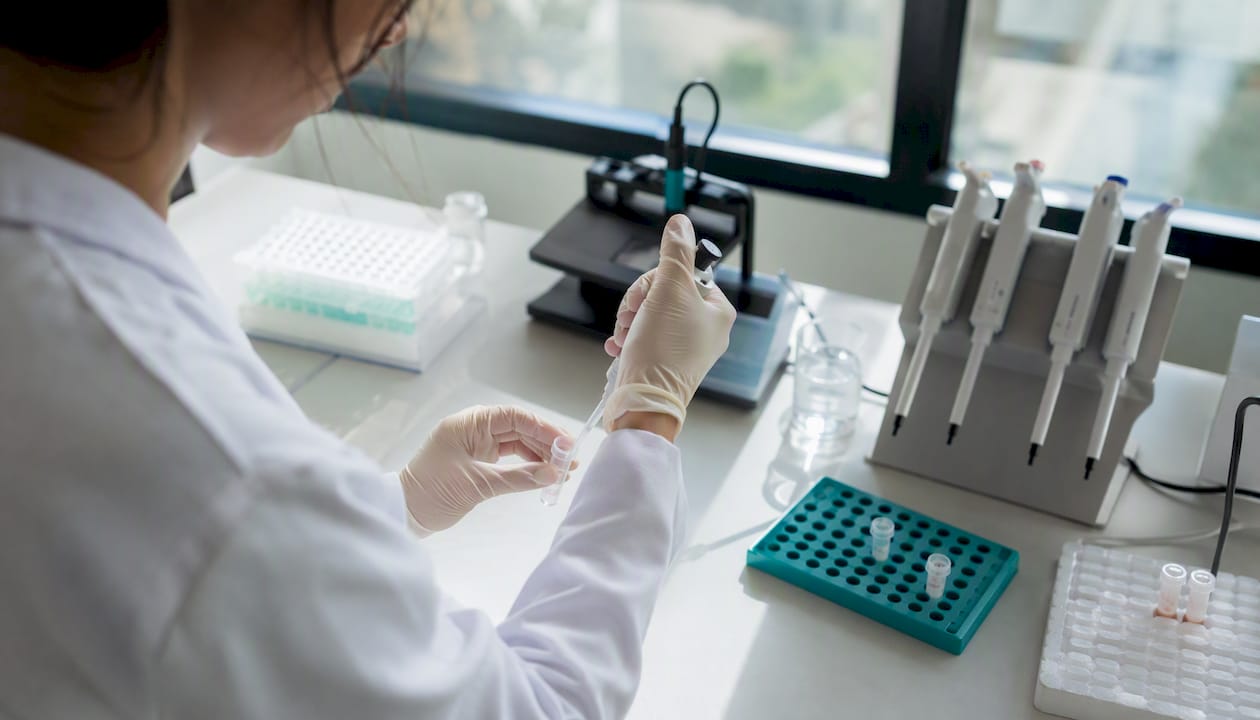
Pro Tip: Always reconstitute a fresh aliquot for each assay day rather than using a repeatedly thawed stock. Freeze–thaw cycles promote aggregation and oxidation, both of which suppress apparent affinity without any visible sign in the tube.
Step-by-step peptide QC workflow
Step 1 — Receive and document:
- Verify lot number against the Certificate of Analysis (CoA).
- Confirm HPLC purity (≥99% for publication-grade work) and MS-confirmed molecular weight.
- Record storage history: was the peptide shipped on dry ice? Was cold chain maintained?
Step 2 — Reconstitution:
- Follow the supplier's recommended solvent (aqueous buffer, DMSO, or mixed). For hydrophobic peptides, dissolve in a minimal volume of DMSO first, then dilute into aqueous buffer.
- Prepare single-use aliquots at a stock concentration of 1–10 mM and store at −80°C under inert atmosphere when possible.
Step 3 — Concentration verification:
Concentration (µM) = mass (µg) / (MW (g/mol) × volume (mL)) × 10³
Worked example: 0.5 mg of a peptide with MW = 1,250 g/mol dissolved in 1 mL: 0.5 mg = 500 µg; 500 / (1,250 × 1) × 10³ = 400 µM
Verify by UV absorbance at 280 nm (if Trp or Tyr present) or by amino acid analysis for peptides lacking aromatic residues.
Step 4 — Pre-assay QC checks:
| QC check | Method | Pass criterion |
|---|---|---|
| Purity | Analytical HPLC | ≥99% main peak area |
| Identity | ESI-MS or MALDI-TOF | Observed MW within ±1 Da of theoretical |
| Aggregation | DLS at working concentration | Z-average < 10 nm |
| Solubility | Visual | No visible particulate |
Step 5 — Documentation for supplementary data:
- Lot number and CoA reference
- HPLC chromatogram and MS spectrum (attach as supplementary figures)
- Reconstitution solvent, date, and stock concentration
- Storage conditions and number of freeze–thaw cycles
- Solubility notes and any observed aggregation
A Certificate of Analysis from a verified supplier should include the HPLC chromatogram, MS data, purity percentage, and recommended storage conditions as standard deliverables, not optional add-ons. Adsorption to low-binding polypropylene tubes is a practical concern for peptides below 1 µM; switch to siliconized or low-binding tubes and pre-block surfaces with 0.1% BSA when working near the Kd.
Key Takeaways
Peptide–receptor binding affinity is most reliably characterized by reporting Kd alongside kon/koff, validated by at least one orthogonal assay, and grounded in HPLC-verified peptide reagents with full CoA documentation.
| Point | Details |
|---|---|
| Kd is the core affinity metric | Report Kd with kon and koff when possible; residence time (1/koff) often predicts in vivo duration better than Kd alone. |
| IC50 and Ki require conversion | Use the Cheng–Prusoff equation to convert IC50 to Ki before comparing across assays or labs. |
| Method choice determines parameters | SPR gives full kinetics; ITC gives thermodynamics; radioligand binding suits membrane receptors. Match method to the question. |
| Sequence context shifts affinity sharply | Single-residue substitutions or flanking changes can alter Kd by up to ~50-fold; validate every modification experimentally. |
| Peptasticlabs reagent QC is foundational | ≥99% HPLC-verified peptides with CoA documentation reduce pre-assay variability and support reproducible affinity reporting. |
The part of affinity measurement most labs get wrong
The field has a tendency to treat a single Kd number as the complete story of a peptide–receptor interaction. It is not. The more consequential error, though, is not the incomplete reporting — it is the upstream problem that makes the Kd unreliable in the first place: the peptide itself.
Mis-reported purity is more common than the literature suggests. A peptide listed at 95% purity on a supplier's website but lacking an attached HPLC chromatogram or MS confirmation is an unknown quantity. That 5% impurity could be a truncation product with partial agonist activity, an oxidized variant with reduced affinity, or an aggregating species that sequesters receptor and artificially depresses your signal. When a binding result looks unusual — affinity ten times weaker than a structurally similar analog, or a Hill coefficient of 0.6 with no obvious biological explanation — the first diagnostic step should be re-running analytical HPLC on the working stock, not re-fitting the binding curve.
Orthogonal validation is the second most skipped step. Researchers who measure Kd by SPR and report that number without a confirmatory assay (ITC, radioligand, or FP) are publishing a single-instrument result. Instrument-specific artifacts — surface orientation bias in SPR, inner filter effects in FP, non-specific binding in radioligand assays — are real and documented. Two independent methods converging on the same Kd is the minimum standard for a result that downstream teams can trust and build on.
For publications and internal reports, the most useful affinity table includes: method, buffer, temperature, receptor construct, peptide sequence with modifications, purity, replicate count, Kd ± SD, and, where available, kon, koff, and ΔH. That level of detail takes one extra column in a table and prevents months of failed follow-up experiments by the next researcher who picks up the project.
Peptasticlabs: research-grade peptides built for affinity work
Affinity data is only as reliable as the peptide used to generate it. Peptasticlabs supplies research-grade peptides verified to ≥99% purity by HPLC, with MS-confirmed identity and full batch documentation available on request. Every compound in the catalog comes with a Certificate of Analysis covering purity, molecular weight, and recommended storage and reconstitution conditions — the exact documentation your methods section needs.
When placing an order, request the HPLC chromatogram, ESI-MS or MALDI-TOF spectrum, solubility notes, and recommended storage temperature as standard deliverables. Peptasticlabs covers metabolic, cognitive, tissue repair, longevity, immunology, and cosmetic research applications, with bulk and wholesale options for higher-volume studies. For in vitro binding assays where reagent purity directly determines data quality, starting with a verified, documented peptide is the single highest-leverage step before any instrument is turned on. Submit a research inquiry or place an order directly at peptasticlabs.com.
Authoritative resources for affinity data and computational tools
The following resources support experimental validation, computational benchmarking, and literature review for peptide–receptor affinity work.
- Drug–Receptor Interactions - Clinical Pharmacology - MSD Manual Professional Edition
- Biomolecular Ligand-Receptor Binding Studies: Theory, Practice, and Analysis
- Receptor binding affinity explained
- Receptor Binding and Peptide Selectivity – PepSpace
- PPI-Affinity: A Web Tool for the Prediction and Optimization of Protein–Peptide and Protein–Protein Binding Affinity
- Design of protein-binding peptides with controlled binding affinity: the case of SARS-CoV-2 receptor binding domain and angiotensin-converting enzyme 2 derived peptides
- The affinity–efficacy problem: an essential part of pharmacology education
- PEPBI: paired structural–thermodynamic database (example reference)
- Sequence context effects on peptide binding (eLife example)
This article provides general scientific information for research purposes. Regulatory requirements for peptide use in the United States vary by application and institutional context; confirm compliance with your institution's IRB, IACUC, or applicable federal guidelines before initiating studies.