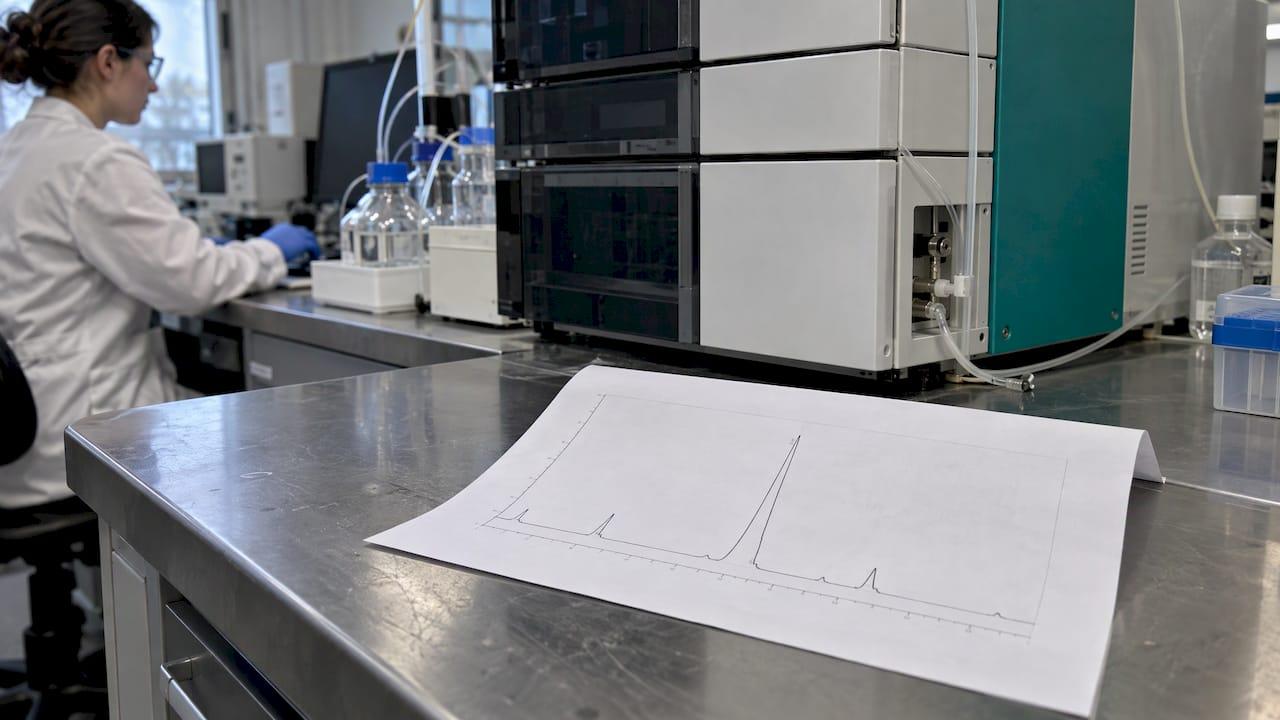
A peptide HPLC chromatogram plots detector response against time. Each peak is a component that left the column at a given retention time, and the area of the main peak relative to all peaks gives the reported purity. The chromatogram shows how much of the detected material is one species. It does not show what that species is. Identity needs mass spectrometry.
This guide covers the axes, the peaks, the purity calculation, baseline features, and how to read a mass spectrum alongside the chromatogram on a Certificate of Analysis (COA).
TL;DR
- X-axis: retention time in minutes. Y-axis: detector response, usually UV absorbance.
- Purity is normally area percent: main peak area divided by total integrated peak area.
- Retention time is method-specific. It does not prove identity.
- Mass spectrometry gives molecular mass. Match the observed m/z to the calculated value for the target sequence.
- Read the chromatogram and the mass spectrum together, and check the method details printed on the COA.
Table of Contents
- What a peptide chromatogram shows
- Retention time: what it can and cannot tell you
- Reading peaks: a step-by-step approach
- How purity is calculated
- What a chromatogram establishes, and what needs other data
- How to interpret a peptide mass spectrum
- HPLC and mass spectrometry together
- Checklist for reviewing a COA chromatogram
- Perspective
- Peptastic Labs catalog for research use
- FAQ
- Sources
What a peptide chromatogram shows
A chromatogram is a trace recorded as the sample passes through the column and detector. Two axes matter:
- X-axis: time since injection, in minutes. Position on this axis is the retention time.
- Y-axis: detector signal. For peptides this is typically UV absorbance, often reported in milli-absorbance units (mAU), at a wavelength where the peptide bond absorbs.
A clean synthetic peptide trace shows one dominant peak, a few small peaks, and a flat baseline. The gradient program, column and detector wavelength are normally listed beside the trace. These details define what the trace means, so read them before the peaks.
How the separation works
Peptides are most often separated by reversed-phase HPLC. The column packing is non-polar, commonly C18-modified silica. The mobile phase starts mostly aqueous, often with 0.1% trifluoroacetic acid (TFA), and the proportion of acetonitrile is raised gradually. Polar components elute first. More hydrophobic ones elute later, so retention depends on how hydrophobic each molecule is.
Practical consequences:
- Truncated or deleted sequences often elute close to the target but at slightly different times.
- Highly hydrophobic species elute late in the gradient.
- Early peaks near the start of the run often come from unretained material such as salts or the sample solvent, not from the peptide.
Retention time: what it can and cannot tell you
Retention time is reproducible only under one method. A different column, gradient, flow rate or temperature shifts it. A peak at 12.4 minutes on one report and 9.8 minutes on another is not, by itself, a discrepancy. The same source also notes that retention time alone does not prove identity.
What to do with it:
- Compare retention times only between runs that use the same method.
- Within one method, use retention time to check batch-to-batch consistency.
- Use mass spectrometry, not retention time, to confirm the compound.
Our article on COA fields that confirm peptide identity lists the fields to look for.
Reading peaks: a step-by-step approach
Step 1: Check the method block
Confirm column type, mobile phases, gradient, flow rate, detection wavelength and injection date. A trace without these cannot be compared with anything.
Step 2: Find the main peak
It should be the tallest and largest peak, near the expected position for the method. Its shape matters. A symmetric peak suggests a well-behaved separation. Fronting, tailing or a shoulder can point to co-eluting species, column overload or a sample-solvent mismatch.
Step 3: Count and size the minor peaks
Note each minor peak, its retention time and its area percent. Impurities in synthetic peptides commonly include deletion sequences, truncated sequences and products of side reactions. The chromatogram sees them only as additional peaks. Identifying them requires mass data. See our overview of peptide impurity profiling for how methods are built to hold up to regulatory expectations.
Step 4: Examine the baseline
The baseline is the signal when nothing elutes. Look at:
- Drift: a baseline that rises across the run is common in gradient elution, because the mobile phase changes absorbance as acetonitrile increases. A blank run subtracts it.
- Noise: high noise makes small peaks hard to integrate.
- Ghost peaks: peaks that appear in a blank injection come from the system or solvents, not the sample.
- Integration marks: check where the software drew its baseline under each peak. Poorly placed baselines change the area.
Step 5: Read the purity figure
See the next section.
How purity is calculated

The reported purity is almost always the area-normalization (area percent) method. The software integrates every peak, adds the areas, and divides the main peak area by the total. A reported ≥99% means the main peak accounts for at least 99% of the integrated UV area under that method.
A worked example with invented numbers:
| Peak | Retention time (min) | Area (mAU·min) | Area % |
|---|---|---|---|
| 1 | 8.9 | 1.2 | 0.4 |
| 2 | 11.6 | 297.0 | 99.0 |
| 3 | 12.3 | 1.8 | 0.6 |
| Total | 300.0 | 100.0 |
Peak 2 is the target: 297.0 ÷ 300.0 = 99.0% area purity.
Factors that change the percentage:
- Wavelength: peptide bonds absorb strongly in the low UV range, so detection there is typical. Other wavelengths weight species differently.
- Gradient steepness: a steep gradient can merge peaks that a shallower one would resolve, raising apparent purity.
- Integration settings: threshold and baseline choices change the areas of small peaks.
- Non-UV-absorbing material: water, counter-ions such as TFA salts and residual solvents are not captured in the area-percent figure. That is why content and residual-solvent data are separate COA items. See residual solvents: testing, limits and COA checks.
- Co-elution: two species under one peak count as one. Our guide to peak purity checks with UV and MS explains how to test for this.
Area percent is a measure of chromatographic purity. It is not the same as net peptide content by weight.
What a chromatogram establishes, and what needs other data
| Question | Chromatogram answers? | Data that answers it |
|---|---|---|
| How much of the detected UV signal is the main peak? | Yes | HPLC area percent |
| Is this batch consistent with the last one under the same method? | Yes | Retention time and profile overlay |
| What is the molecular mass? | No | Mass spectrometry |
| Is the sequence correct? | No | MS/MS fragmentation |
| How much peptide per vial by weight? | No | Net peptide content testing |
| Are there residual solvents? | No | Dedicated solvent analysis |
The chromatogram is one piece of a COA. Pairing it with mass data gives separation plus identity.
How to interpret a peptide mass spectrum
A mass spectrum plots relative abundance on the y-axis and m/z on the x-axis. Peak-to-peak mass differences between fragments can reveal amino acid composition and sequence.
For a COA the first job is simpler: find the molecular mass.
Singly and multiply charged ions
Mass spectrometry measures mass-to-charge ratio. For a singly charged ion, m/z equals the molecular mass plus one proton mass (about 1.008). For multiply charged ions the same source gives m/z = (M + n × 1.008) / n, where n is the charge.
Electrospray ionization (ESI) typically produces a series of charge states for one peptide. Larger peptides show more charge states.
Worked example: deconvoluting two peaks
Suppose a peptide has a calculated mass of 1000.000 Da. The expected ions are:
- [M+2H]²⁺: (1000.000 + 2 × 1.008) / 2 = 501.008
- [M+3H]³⁺: (1000.000 + 3 × 1.008) / 3 = 334.341
Given only the two observed values, the same source describes how to find the charge from adjacent charge-state peaks. With m1 = 501.008 and m2 = 334.341:
- n = (m2 − 1.008) / (m1 − m2) = 333.333 / 166.667 = 2
- M = n × (m1 − 1.008) = 2 × 500.000 = 1000.000
The result matches the calculated mass. Real data show small deviations. Compare the observed mass with the theoretical mass for the stated sequence. Our amino acid molecular mass reference gives the residue values for calculating it.
What to check on the spectrum
- The deconvoluted mass agrees with the theoretical mass for the labeled compound.
- Charge-state series is consistent, not a single unexplained peak.
- Adducts (sodium, potassium) are recognized as such and not mistaken for impurities.
- Any strong unassigned ions are explained or matched to a minor chromatogram peak.
For workflows that go beyond intact mass, see our LC-MS/MS workflow for peptides.
HPLC and mass spectrometry together
HPLC separates and quantifies by UV. MS identifies by mass. They answer different questions, and a COA that carries both is more informative than either alone. When the two are coupled (LC-MS), each chromatographic peak gets its own mass spectrum, which links an impurity peak to a mass.

Which method suits which question depends on the task. Routine purity release is often done by HPLC-UV, while impurity identification calls for LC-MS. Our comparison, HPLC vs LC-MS for peptide QC, sets out when each fits.
Checklist for reviewing a COA chromatogram
- Batch or lot number on the report matches the vial.
- Method block present: column, mobile phase, gradient, wavelength.
- Main peak identified, with retention time and area percent.
- Integration baseline visible and sensible.
- Blank or system-suitability reference where provided.
- Mass spectrum with observed mass and theoretical mass.
- Test date and laboratory named.
- Raw chromatogram available. See how to request raw chromatograms.
Perspective
Our position is that a purity percentage is only as useful as the documentation behind it. A number without the trace, the method and the mass data cannot be reviewed.
We test each batch by HPLC and mass spectrometry, keep traceable batch documentation, and supply Certificates of Analysis on request. Our catalog of over 22 compounds is specified at ≥99% purity by HPLC.
For researchers, the practical benefit is comparability. When the chromatogram, the method block and the observed mass sit on one document, a result can be checked against the labeled compound and against the previous batch.
Tintastic
Peptastic Labs catalog for research use
Peptastic Labs supplies research-grade peptides across metabolic, cognitive and neuro, tissue and repair, longevity, cosmetic science, blends, hormone and reproductive, and ancillaries and reagents lines. Each compound is independently tested and HPLC-verified to ≥99% purity, with batch documentation and Certificates of Analysis on request. Bulk and wholesale options are available. Products are for laboratory research use by qualified researchers.
Browse the full range in the Peptastic Labs catalogue.
FAQ
What does a good peptide HPLC chromatogram look like?
One dominant, symmetric peak, minor peaks of small area, and a flat, low-noise baseline. The method details should be printed on the report. A reported purity of ≥99% means the main peak holds at least 99% of the integrated area.
Does the retention time tell me which peptide it is?
No. Retention time depends on the column, gradient, flow rate and temperature, so it is comparable only under the same method. Identity is confirmed by mass spectrometry, by matching the observed mass to the theoretical mass of the sequence.
Is HPLC purity the same as peptide content?
No. HPLC purity is the main peak's share of the detected UV area. Water, counter-ions and residual solvents are not part of that figure. Net peptide content and residual solvents are measured separately and listed as separate COA items.
How do I read the m/z values on a peptide mass spectrum?
For a singly charged ion, subtract about 1.008 from m/z to get the mass. For multiply charged ions, use M = n × (m/z − 1.008), where n is the charge. Compare the result with the theoretical mass for the stated sequence.
Can I ask for the raw chromatogram?
Yes. Request the raw trace along with the method block and mass spectrum. We supply Certificates of Analysis on request, and our guide on requesting raw chromatograms lists what to ask for.
Sources
- How to read an HPLC chromatogram on a certificate of analysis, QLD Analytical
- Verify Peptide Identity: Mass Spec for Beginners, ChemVerify
- Mass Spectrum Explained, Pearson