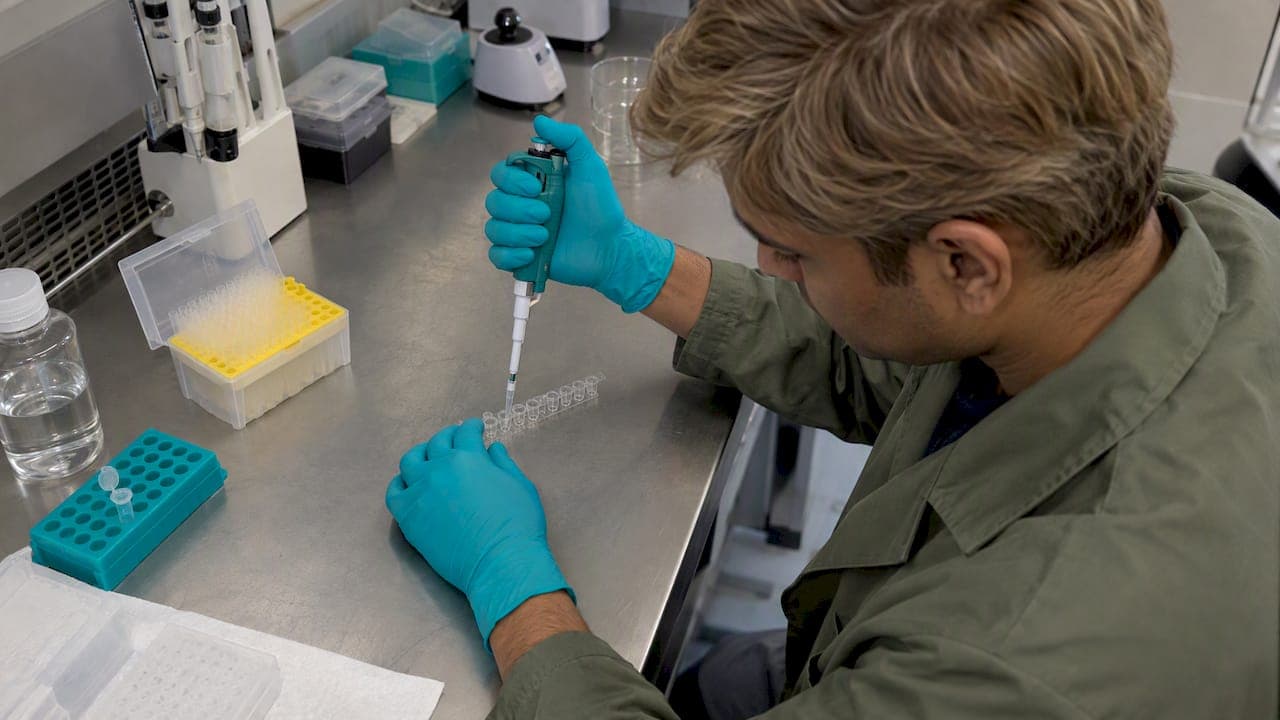
An in vitro peptide concentration is set by the assay, not by a universal number. Start from known or expected affinity, or from a published range for your model. Then bracket it with a wide dose-response series, and verify solubility, purity and dilution maths before the first plate. This guide covers each step for research use only, with a worked stock-to-final calculation.
TL;DR
- Pick the starting concentration from affinity data. For isothermal titration calorimetry (ITC) with known affinity, aim for a c value of 10–50. With unknown affinity, start at 50 µM ligand and 5 µM protein.
- Build a dose-response series across several log units. For binding assays, vary incubation time over at least a 10-fold range to confirm equilibrium.
- Make a concentrated stock (10–1000 times the target), confirm full solubilization, then serial-dilute and carry every dilution factor into the final figure.
- Use peptide of >95% chemical purity as a minimum. Store dry powder at −20°C or below for long-term storage.
- Report assay validation, vehicle and how concentration was quantified, not only the nominal dose.
Table of Contents
- What "concentration" means in an in vitro peptide assay
- Choosing a starting concentration
- Designing the dose-response range
- Calculating final concentration from stock
- Factors that shift the effective concentration
- Storage that protects concentration
- Reporting concentration so others can reproduce it
- Common errors
- Perspective
- Sourcing documented peptides for your assays
- FAQ
- Sources
What "concentration" means in an in vitro peptide assay
In cell-free and cell-based work, peptide dose is a concentration in a defined volume: nM, µM or mM in buffer or medium. It is not a dose per body weight. Three values get confused:
| Term | Meaning | Where it matters |
|---|---|---|
| Nominal concentration | Calculated from weighed mass and volume | Stock preparation |
| Effective concentration | Peptide actually free and active in the well | After adsorption, aggregation or degradation |
| Measured concentration | Quantified by an analytical method | Reporting and reproducibility |
The gap between nominal and effective is the main reason two labs using the same "10 µM" get different results. The sections below close that gap step by step.
For a broader view of assay formats, see our overview of in vitro peptide testing methods and applications.
Choosing a starting concentration
The starting point depends on what the assay measures.
Binding and calorimetry assays
For ITC with known affinity, the Cambridge Biochemistry facility guideline sets the working window with the c value: c = n × Ka × Mcell, aiming for 10–50, or 10–20 for an iTC200. Here Ka is the association constant, n the stoichiometry and Mcell the macromolecule concentration in the cell.
When affinity is unknown, the same guideline suggests starting at 50 µM ligand in the syringe and 5 µM protein in the cell, then increasing concentrations if the injection peaks are too small. That is a 10:1 ratio, which suits a 1:1 binding model.

For background on how affinity relates to concentration choice, read our researcher's guide to peptide receptor binding affinity.
Cell-based and functional assays
Cell assays have no single rule. Practical approach:
- Find the effective range in published work on the same peptide class, cell type and readout.
- Centre your series on that range and extend at least one log unit above and below.
- Run a pilot plate before committing precious cells or reagent.
- Confirm the top concentration does not change the vehicle fraction beyond your tolerated level.
If the literature gives only a single concentration, treat it as one point on a curve, not as the answer.
Designing the dose-response range
A dose-response series should define the baseline, the transition and the plateau. A common layout:
- 8 to 12 concentrations
- Half-log or 3-fold spacing (for example 1 nM, 3 nM, 10 nM, 30 nM, 100 nM, 300 nM, 1 µM, 3 µM, 10 µM)
- Technical triplicates at minimum
- Biological replicates from independent preparations
Controls to include on every plate:
- Vehicle control: same solvent and buffer fraction as the highest dose.
- Untreated control: no addition.
- Positive control: a compound with a known response in the system.
- Blank: medium or buffer only, for background.
Exposure time is part of the dose
Concentration and time interact. Jarmoskaite et al. caution that a good fit does not prove equilibrium, and recommend that incubation time be varied across a range of at least 10-fold so that binding constants (Kd) are not misestimated. If values shift with time, equilibrium was not reached.
For compounds that dissociate slowly, longer observation time improves precision and accuracy. In competition kinetic assays, Sutcliffe et al. found measurement frequency and observation time matter more for rate constants than tracer concentration.
Practical consequence: log the exact incubation time with every concentration, and do not compare 1-hour and 24-hour results as if they were the same experiment.
Calculating final concentration from stock

Stock preparation is where most concentration error starts. The recommendations for generating and storing peptide standards describe the sequence: weigh the lyophilized peptide accurately, reconstitute to a concentrated stock 10–1000 times the target, then serial-dilute in a suitable buffer or solvent, counting every dilution step in the final figure. The same source stresses verifying solubilization first: the solution should be clear with no flecks before any dilution.
Core formulas
- Moles of peptide = mass (g) ÷ molecular weight (g/mol)
- Stock concentration = moles ÷ volume (L)
- Dilution (C1V1 = C2V2): V1 = (C2 × V2) ÷ C1
- Dilution factor = C1 ÷ C2
Worked example
Target: 5 µM final peptide in a 200 µL well. Peptide molecular weight: 1,000 g/mol (illustrative).
- Weigh 5 mg. Moles = 0.005 g ÷ 1,000 g/mol = 5 µmol.
- Dissolve in 1 mL. Stock = 5 µmol ÷ 0.001 L = 5 mM.
- Intermediate dilution: 10 µL stock + 990 µL buffer = 50 µM (1:100).
- Final: C1V1 = C2V2, so V1 = (5 µM × 200 µL) ÷ 50 µM = 20 µL of 50 µM into the well, brought to 200 µL with medium.
- Check: 50 µM × 20/200 = 5 µM. Total dilution from stock = 1:1,000.
Vehicle carryover: if the stock were in a solvent, the well now holds 0.1% of it. Add the same fraction to every control well.
Net peptide content
A lyophilized vial contains peptide plus counterions and bound water, so weighed mass is not always equal to peptide mass. When the certificate of analysis states peptide content, correct the weighed mass for it. If it does not, quantify the stock by an analytical method before using nominal values for a Kd or EC50.
Pipetting and serial dilution practice
- Do not pipette below the validated range of the pipette. Use an intermediate step instead.
- Change tips between dilution steps.
- Mix each step fully before transferring.
- Prepare dilutions fresh from stock or from single-use aliquots.
- Record lot, vial, date and operator for each stock.
Factors that shift the effective concentration
Solubility and hydropathy
Peptide hydropathy, stability and solubility all determine what can be dissolved. Extremely hydrophobic peptides can have solubility problems, and the same recommendations advise higher acetonitrile percentages for more hydrophobic sequences. Check what your cells or enzyme tolerate before choosing a co-solvent. Our guide to peptide solvent safety covers handling from pH to PPE.
Purity
The same recommendations specify purified peptides should have >95% chemical purity. Impurities such as truncated or deletion sequences can bind, compete or be cytotoxic, so a nominal 10 µM of a 90% pure peptide is not 10 µM of the target. Our catalog is documented at ≥99% HPLC purity, supported by batch documentation. For how to read that documentation, see peptide purity standards for research and peak purity checks and COA review.
Identity
Purity answers how much of the sample is one species. Identity answers whether that species is the right one. Mass spectrometry confirms identity; see which COA fields confirm peptide identity and the HPLC versus LC-MS comparison.
Adsorption, aggregation and degradation
At low nM concentrations, a measurable fraction of peptide can be lost to tube and tip surfaces. Aggregation, oxidation and proteolysis in serum-containing medium lower the active fraction over time. Mitigations used in practice:
- Low-binding tubes and tips for dilute solutions
- Fresh dilutions on the day of the assay
- Matched controls for medium with and without serum
- Measured concentration (LC-MS) at start and end of incubation for critical experiments
Storage that protects concentration
The storage guidance in the peptide standards recommendations is specific:
- Dry powder: −20°C or below for long-term storage (more than 6 months).
- Short-term (up to 3 months): stocks at high concentration (1–100 pmol/µL) can be kept as liquids at 4°C or frozen at −20°C to −80°C, per Hoofnagle et al. (2016), as cited there.
Working habits that keep the stated concentration true:
- Aliquot stock in single-use volumes to avoid repeated freeze-thaw cycles.
- Label with concentration, solvent, date and lot.
- Let vials reach room temperature before opening, to limit condensation.
- Discard working dilutions after the experiment.
Reporting concentration so others can reproduce it
A concentration without its context cannot be reproduced. The best-practice paper on targeted peptide measurement asks authors to report fit-for-purpose validation: precision, accuracy, specificity, sensitivity (LOD, LOB, LLOQ), linearity and how quantitation was done.
Minimum reporting checklist:
- Peptide sequence, modifications, supplier lot and COA purity
- Molecular weight and net peptide content used in calculations
- Solvent, stock concentration and storage history
- Every dilution step and the final vehicle fraction
- Incubation time and temperature
- Replicate structure and controls
- Curve model, fit software and how outliers were handled
Robustness
Bioassay development guidance describes testing robustness by identifying critical factors such as reagent concentration, temperature and pH, and defining a design space in which the assay stays accurate and repeatable. The same article notes that dose masking, used to help curve fitting, should follow established guidance, such as three consecutive doses. Decide masking rules before looking at data, and state them in the methods.
Common errors
| Error | Effect | Fix |
|---|---|---|
| Using weighed mass as peptide mass | Concentration overstated | Correct for net peptide content |
| Single incubation time | Kd misestimated if not at equilibrium | Vary time at least 10-fold |
| Vehicle differs between wells | Solvent effect read as peptide effect | Match vehicle in all wells |
| Narrow dose range | Incomplete curve, unreliable EC50 | Span several log units |
| Repeated freeze-thaw | Loss of active peptide | Single-use aliquots |
| Skipping solubility check | Undissolved peptide, wrong concentration | Confirm clear solution first |
Perspective
Concentration problems in peptide studies often begin before the first pipetting step. Weighed mass, identity and purity are assumed, then the dose-response curve takes the blame.
Our approach is to make those inputs verifiable. Each catalog compound is documented at ≥99% purity by HPLC, with mass spectrometry and batch documentation behind it, and a Certificate of Analysis is available on request. We designed this so that the nominal concentration in your protocol is closer to the effective one.
We recommend reading the COA before calculating stock. Check the molecular weight, purity and identity data, and request the raw chromatogram if peak shape matters to your assay. Documented inputs make a dose-response curve easier to interpret and to reproduce.
Tintastic
Sourcing documented peptides for your assays
Peptastic Labs supplies research-grade peptides across metabolic, cognitive and neuro, tissue and repair, longevity, cosmetic science, hormone and reproductive, blends, and ancillaries and reagents lines. Compounds are independently tested, HPLC-verified to ≥99% purity, with batch documentation and Certificates of Analysis on request. Bulk and wholesale options are available. Products are supplied for laboratory research only. See the full peptide catalogue for current availability.
Before ordering, ask for the COA of the lot you will receive, and request raw chromatograms if your protocol depends on them. Our guide to requesting raw chromatograms in HPLC peptide testing lists what to ask for.
FAQ
What concentration range should I test for a new peptide?
Center the series on published effective concentrations for the same peptide class, cell type and readout. Extend at least one log unit either side, with 8 to 12 points. If affinity is unknown in an ITC experiment, a 50 µM ligand and 5 µM protein start is a documented starting point.
How concentrated should the stock solution be?
Make the stock 10 to 1000 times higher than the target concentration. This keeps the vehicle fraction in the final well low and avoids pipetting very small volumes. Confirm the solution is clear before diluting.
How long should I incubate to get a reliable result?
Do not assume. For binding studies, vary incubation time over at least a 10-fold range and check that the result stops changing. Slowly dissociating compounds need longer observation.
How should I store peptide stocks?
Keep dry powder at −20°C or below for storage beyond 6 months. For up to 3 months, concentrated liquid stocks can be held at 4°C or frozen between −20°C and −80°C, as described in the peptide standards recommendations. Use single-use aliquots.
Does purity change the concentration I should use?
Yes. Impurities reduce the amount of target peptide per weighed milligram and can add their own effects. Use peptide of at least >95% chemical purity, and correct calculations using the COA purity and peptide content.
Sources
- ITC Sample Preparation Guidelines, University of Cambridge
- How to measure and evaluate binding affinities, PMC
- Considerations for improved performance of competition kinetic assays, PMC
- Recommendations for the generation, quantification, storage and handling of peptides, PMC
- Targeted Peptide Measurements in Biology and Medicine: Best Practices, PMC
- Essentials in Bioassay Development, BioPharm International